The Analysis Dividend: a ten-page answer to the fairest question in delivery
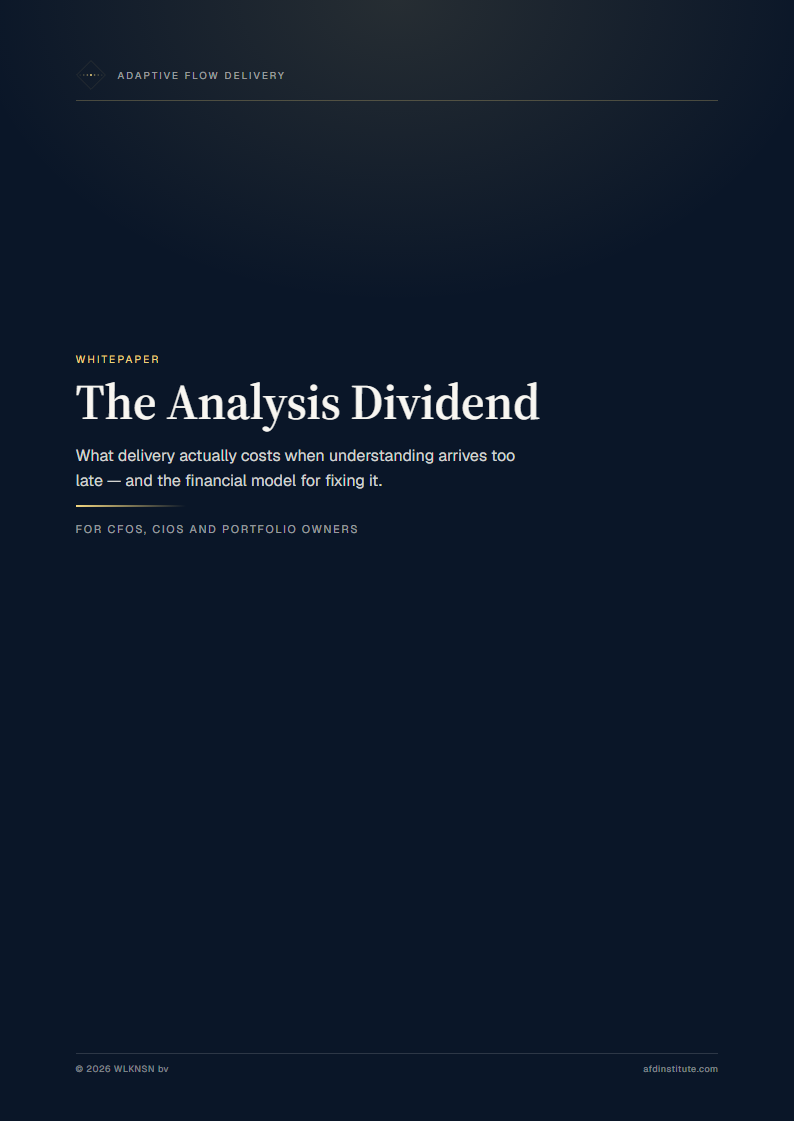
A free ten-page whitepaper on what delivery costs when understanding arrives too late — defect economics, a worked 200-requirement example, a EUR 500,000 project modelled two ways, and four cases where the maths does not work.
A finance director once asked me a question I answered badly for years: why are we spending a third of the budget before anyone writes a line of code?
It is the fairest question in delivery. And most of us answer it with conviction where we should be offering arithmetic.
So we have written the arithmetic down. The Analysis Dividend is a ten-page whitepaper on what delivery actually costs when understanding arrives too late — and what changes when it arrives on time. It is free, and there is no form to fill in.
What is in it
What a defect costs by the stage you find it. Roughly 1× in requirements, 10× in build, and 50 to 100× once it reaches production. On a project producing a hundred defects, the fifth of them that reach production account for most of the total cost.
A worked example with two hundred requirements. Reduce the misunderstanding rate from 15% to 3% and you avoid 480 hours of rework for a 200-hour analysis investment. Net gain: 280 hours, before any of the downstream savings.
A €500,000 project modelled twice. Same organisation, same stakeholders, same business need — delivered traditionally and delivered analysis-first. Three-year total cost of ownership: €909,375 against €448,890.
The prevention, detection and correction split. Most organisations spend 45–60% of their quality budget on correction and 10–15% on prevention. Inverting that ratio lowers total quality spend rather than raising it.
And four situations where the maths does not work. Very small projects, genuinely exploratory work, hard regulatory deadlines, and teams that already hold the domain understanding. A model that works everywhere works nowhere in particular, so the paper says plainly where this one stops.
On the numbers
The delivery percentages in the paper are observations drawn from European engagements, calibrated to 2026 conditions. They are not measurements from a controlled study population, and the paper says so on the page rather than in a footnote. They are there to be tested against your own figures, not adopted on faith.
The last section is a set of four questions that produce your own number. Most organisations have never counted what rework costs them. That absence is usually the finding.
Download The Analysis Dividend (PDF, 10 pages) — no email required.
The full model sits in Chapter 10 of Adaptive Flow Delivery, with the capacity argument behind it in Chapter 11.